Case studies

Infrastructure that fails predictably, or not at all

Three pieces of work with the same shape: measure what is there, fix what actually breaks systems, and leave evidence that it changed. Built and verified in a lab, so every screenshot and every configuration file here can be published without redaction.

Linux hardening Network segmentation Monitoring & alerting MikroTik RouterOS Prometheus · Grafana · Loki

01 — Linux server hardening with a measured result

Ubuntu Server · Lynis · nftables · fail2ban · auditd · AIDE

The starting point

What most providers hand over after clicking “deploy”:

  • Password authentication on SSH port 22
  • Root login permitted
  • No firewall at all
  • Automatic security updates switched off
  • No audit trail, no file integrity checks

What I changed

  • Key-only SSH, root login off, attempts limited, forwarding disabled
  • Default-deny firewall with an explicit allow list
  • fail2ban on exposed services, unattended upgrades verified, not just installed
  • Kernel hardening via sysctl: redirects, source routing, ASLR, restricted pointers
  • auditd rules on passwd, shadow, sudoers, sshd_config and root command execution
  • AIDE for file integrity, password policy, restricted cron and compilers
Lynis index before
59
Lynis index after
84
Time per server
2–3 h
Repeatable
Scripted baseline

Lynis audit on a default Ubuntu installation
Before — default installation audited with Lynis
Lynis audit after the hardening baseline
After — the same audit once the baseline is applied
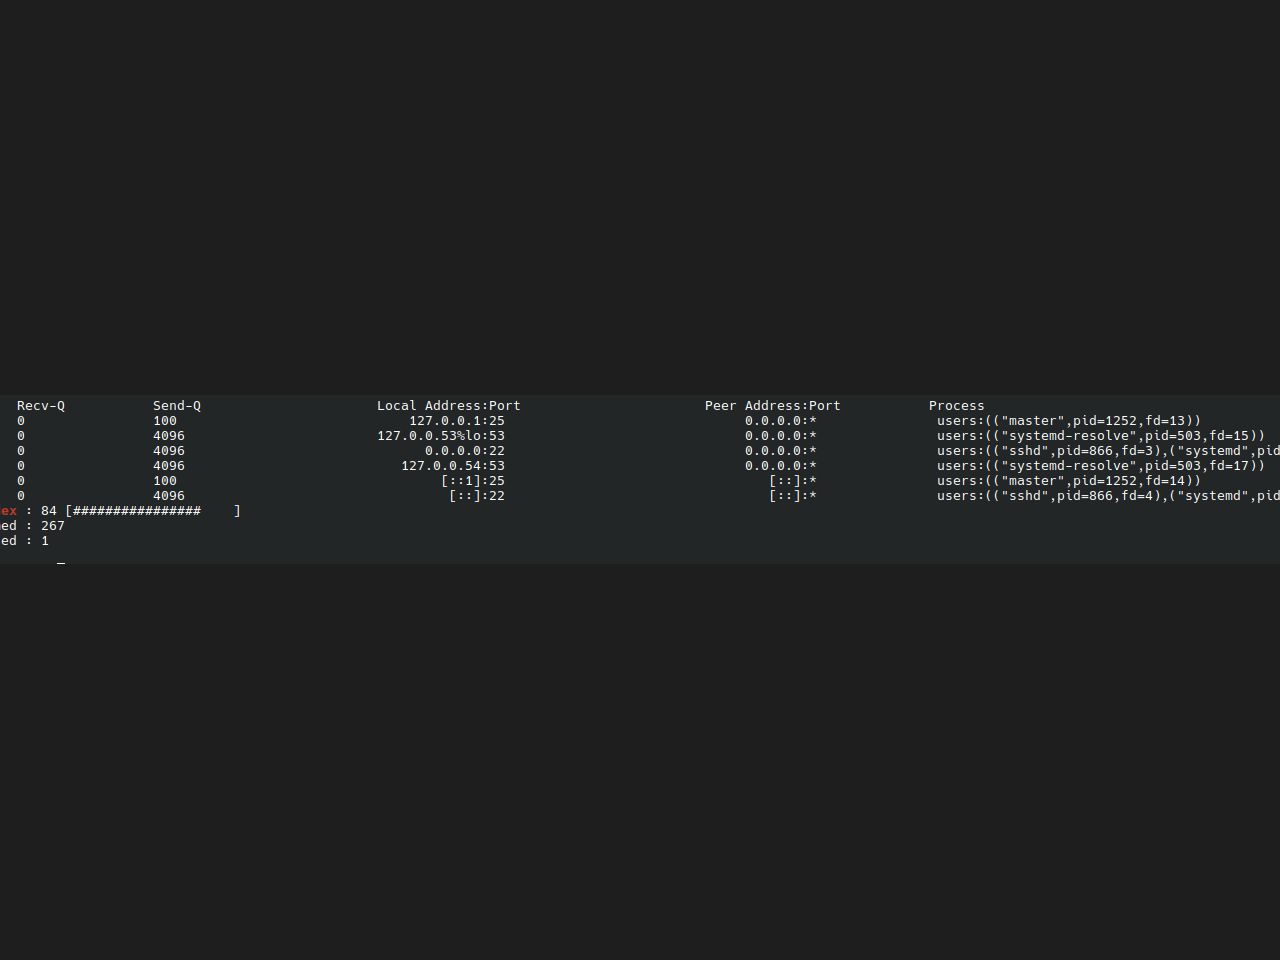
Listening services after hardening
After — listening sockets reviewed, only what the server serves remains

The client does not receive “it is secure now”. The client receives a change log — what changed, why, and how to roll each item back — plus both audit reports as evidence. Most compromised servers I have seen failed on two things: password authentication on SSH, and updates nobody installed. Neither is sophisticated.
02 — Flat network rebuilt into isolated segments

MikroTik RouterOS · VLAN · policy chains · address lists · WireGuard

The starting point

One subnet, the factory firewall, every device able to reach every other device. The router defends itself from the internet and does nothing about what happens inside.

An IP camera running firmware from 2019 sits in the same broadcast domain as the accountant’s workstation. Nothing in the default configuration considers that a problem.

The design

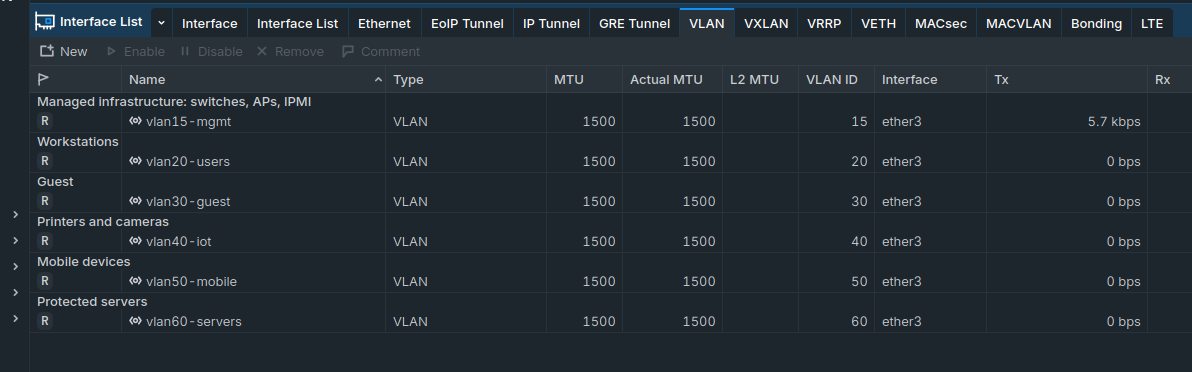
  • Six segments: management, workstations, guests, IoT, protected servers, remote access
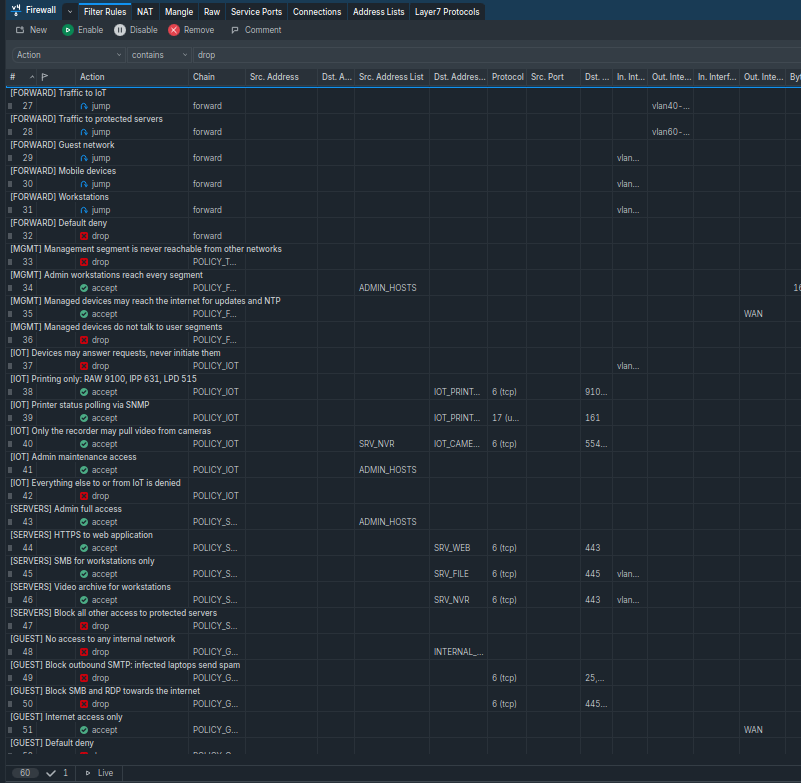
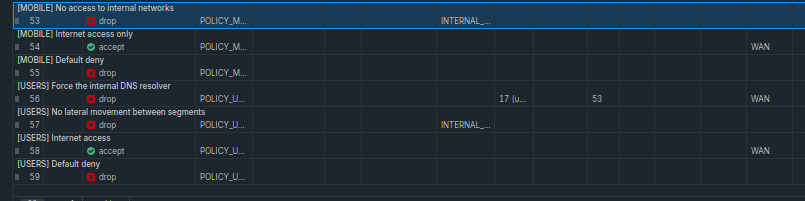
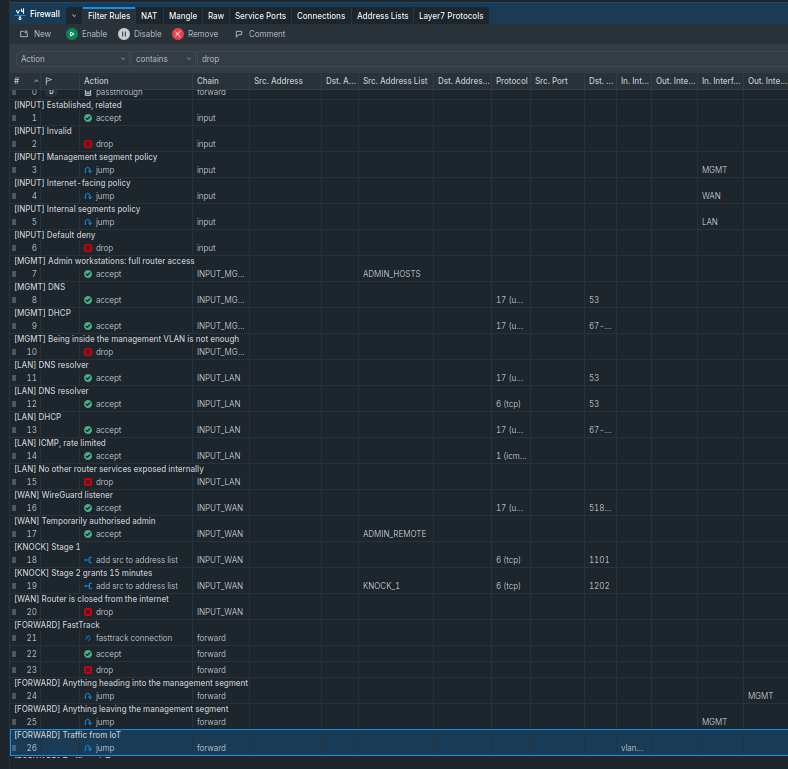
  • Traffic classified once, then handed to a named policy chain per segment
  • Every chain ends with an explicit drop — nothing leaks by accident
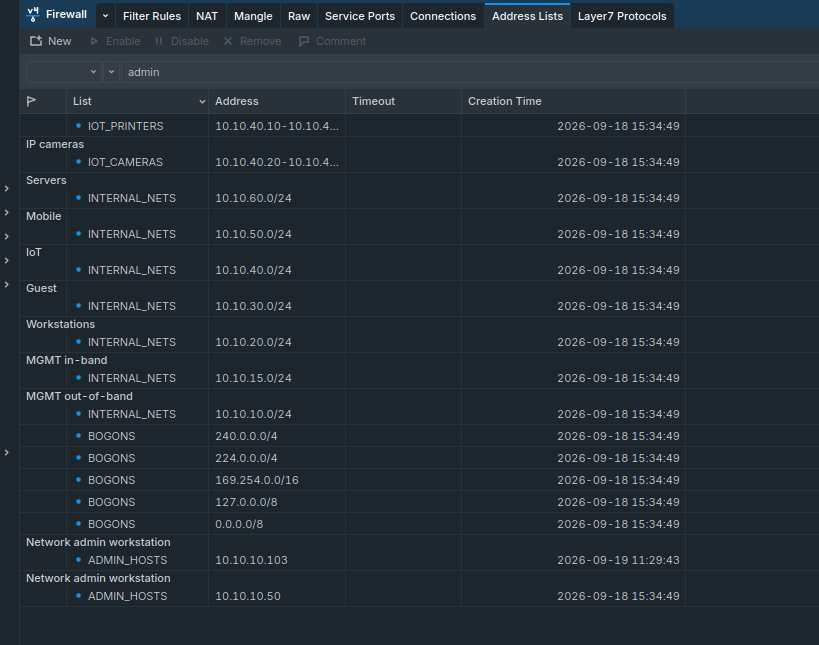
  • Hosts referenced through address lists, so adding a device is a one-line change

Decisions worth naming

  • IoT devices may answer, never initiate. A printer is reachable on printing ports only. Cameras are reachable only by the recorder, matched by address list. A compromised camera has nowhere to go and nothing to call home to.
  • Management is one-way. Administrators reach every segment; no segment can open a session towards management. Return traffic still works, so the asymmetry costs nothing operationally.
  • Guests cannot send outbound SMTP. Not theory — an infected laptop on guest wifi is how offices end up on spam blacklists.
  • All DNS is answered by the router and forwarded over DNS-over-HTTPS. Devices with a hard-coded resolver are redirected anyway.

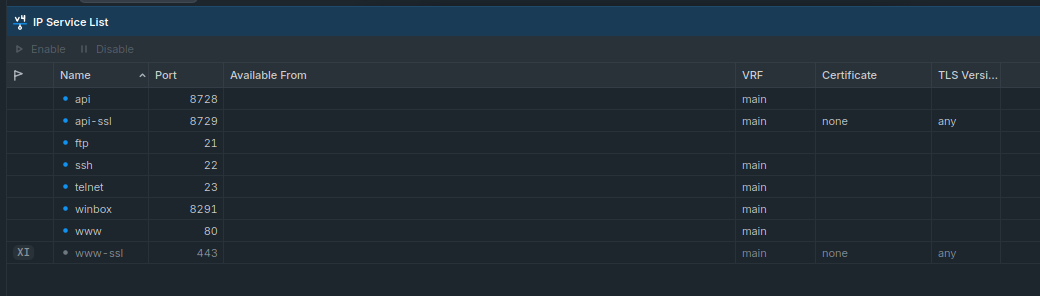
Access to the router itself

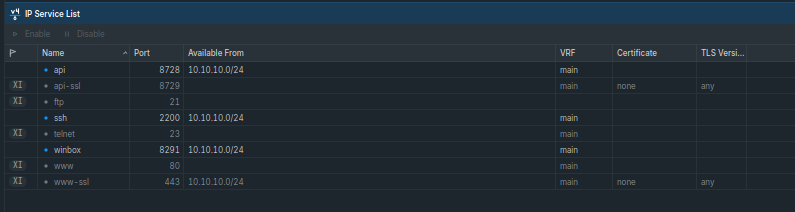
  • Services restricted by interface list and source subnet
  • SSH moved off port 22; Telnet, FTP and HTTP disabled
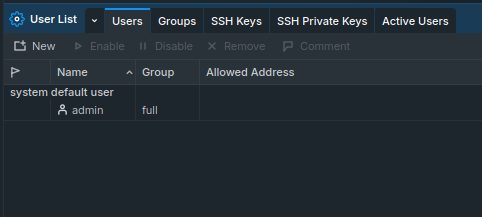
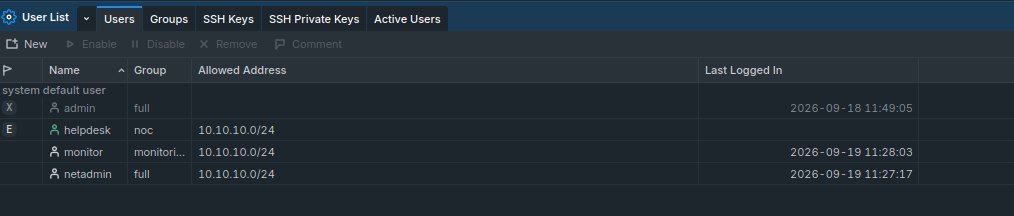
  • Accounts bound to source addresses — a leaked password is not enough on its own
  • Port knocking opens emergency remote access for fifteen minutes
  • Scanner detection in the raw table, before connection tracking
  • Changes applied under Safe Mode with automatic rollback
Segments
6
Firewall rules
60+ commented
IoT internet access
None
Deliverables
Diagram · export · docs

Before

Single subnet before segmentation
Before — one flat subnet for the whole office
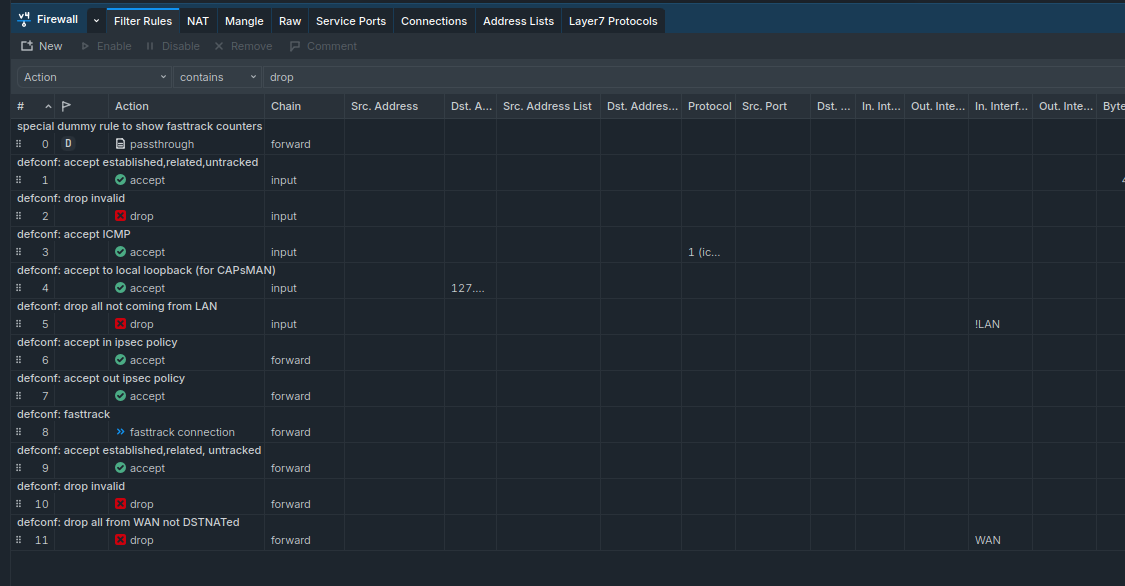
Factory default firewall rules
Before — factory firewall: the router is protected, internal traffic is not filtered
All router services enabled
Before — Telnet, FTP, HTTP and the API open to the whole network
Single admin account
Before — one shared account, reachable from anywhere

After

Named policy chains in the firewall
After — traffic classified once, then handed to a named policy chain
Per-segment firewall policy
After — per-segment policy, every chain ending in an explicit drop
Input chain policy
After — access to the router itself, split by where the traffic comes from
VLAN interfaces
After — six segments on a single trunk port
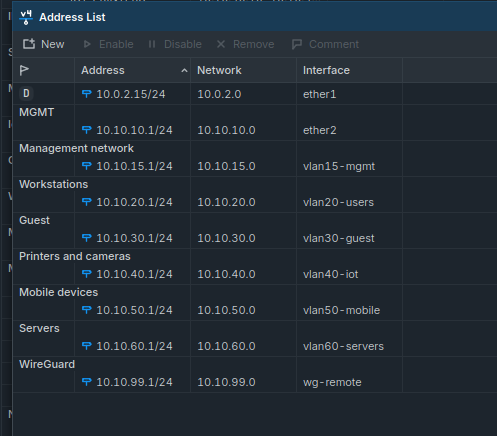
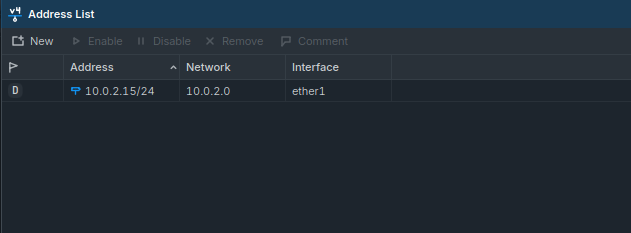
Addressing plan
After — addressing plan: management in-band and out-of-band, users, guests, IoT, servers, VPN
Firewall address lists
After — address lists instead of hard-coded addresses in rules
NAT rules
After — DNS redirected to the router, published service with hairpin for internal users
Restricted router services
After — services limited to the management subnet, unused ones disabled
Accounts bound to source addresses
After — separate accounts, each bound to a permitted source address

03 — Monitoring that tells you something useful

Prometheus · Grafana · Loki · Docker Compose · Telegram alerting

The problem with most monitoring

It has one of two faults. Either nothing is watched at all, or everything is watched and nobody reads the alerts — which amounts to the same thing.

An alert channel that cries wolf gets muted within a week. After that the monitoring exists only on paper.

What is actually watched

  • Filesystem usage with a trend, not a bare percentage — a disk at 60% growing for three days matters more than one sitting at 85% and stable
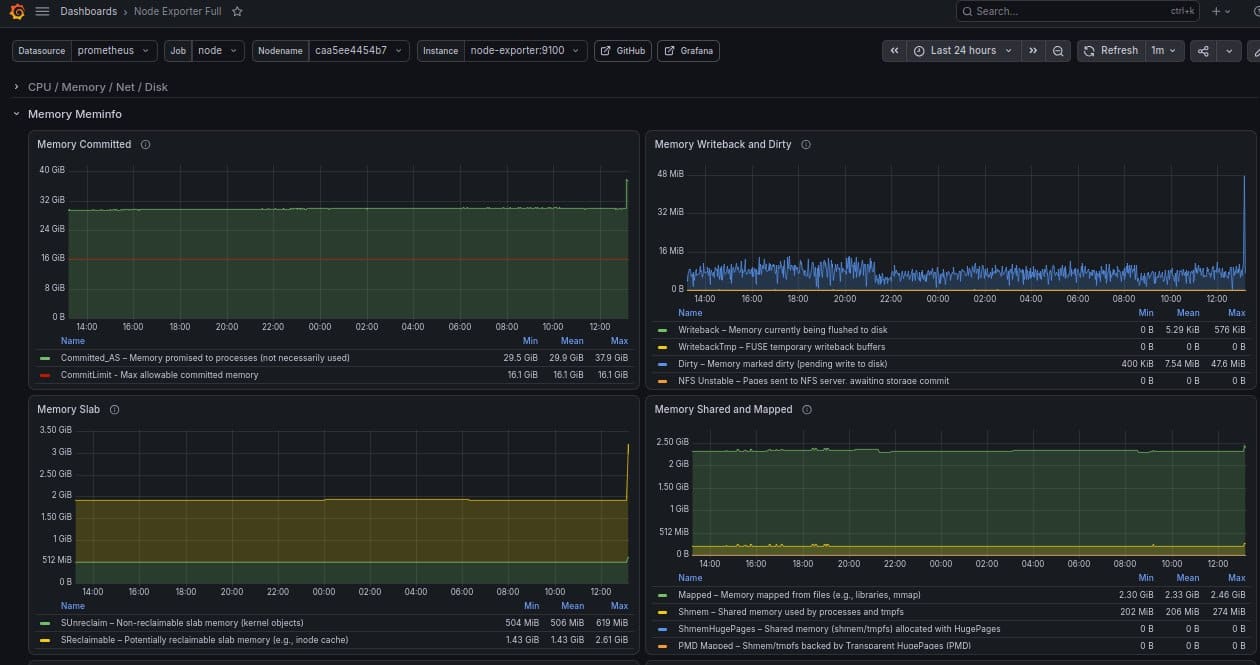
  • Memory behaviour rather than the used figure: committed memory against the limit, slab growth, whether the system has started swapping
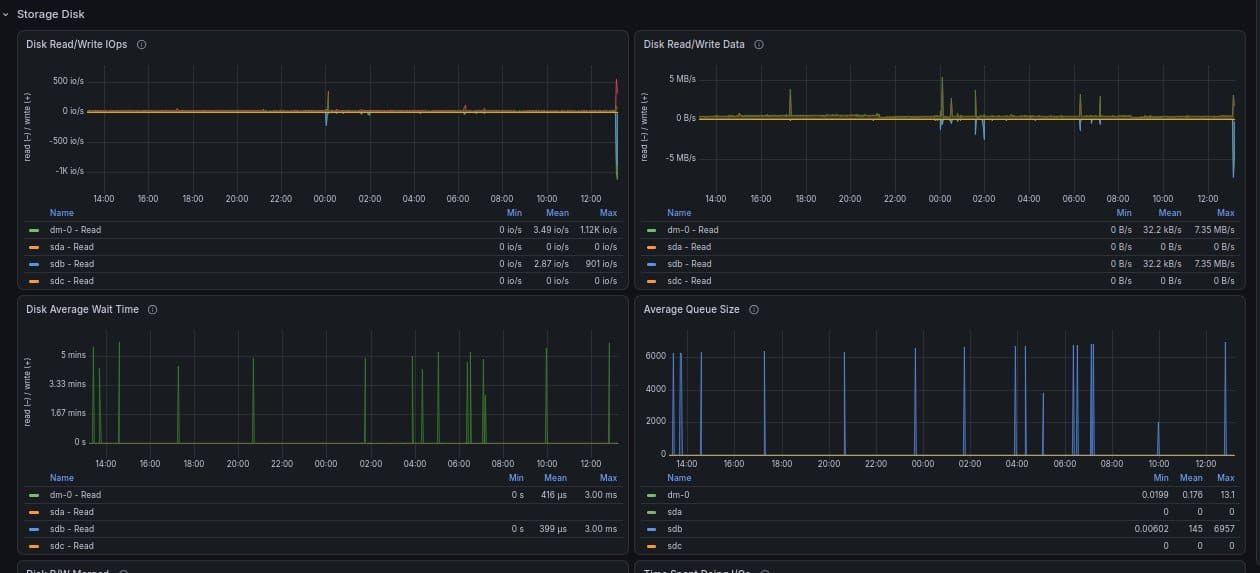
  • Disk latency and queue depth — slow storage shows up here long before anyone calls the system slow
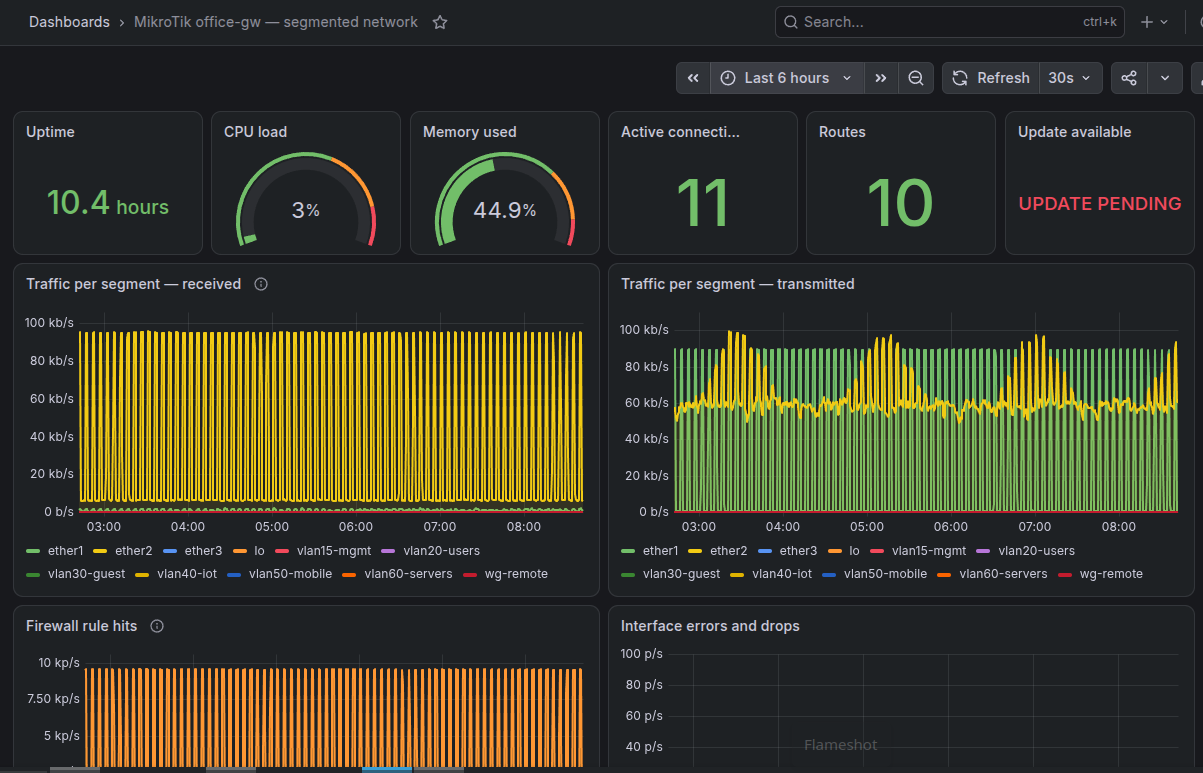
  • Per-interface throughput, so traffic is visible per segment instead of as one number

How it is deployed

  • Docker Compose, with datasources and dashboards provisioned from files
  • The stack rebuilds from a repository in minutes instead of being clicked together
  • Metrics from network hardware collected over the API, not SNMP guesswork

The detail that matters most

The exporter account has read rights only and is bound to the address of the monitoring host. Monitoring can observe the infrastructure; it cannot change it.

That is not paranoia. A monitoring system holds credentials to everything, which makes it a target rather than a bystander.

Metrics collected
System · network · firewall
Exporter rights
Read-only
Alert delivery
Telegram · email
Setup time
4–6 h
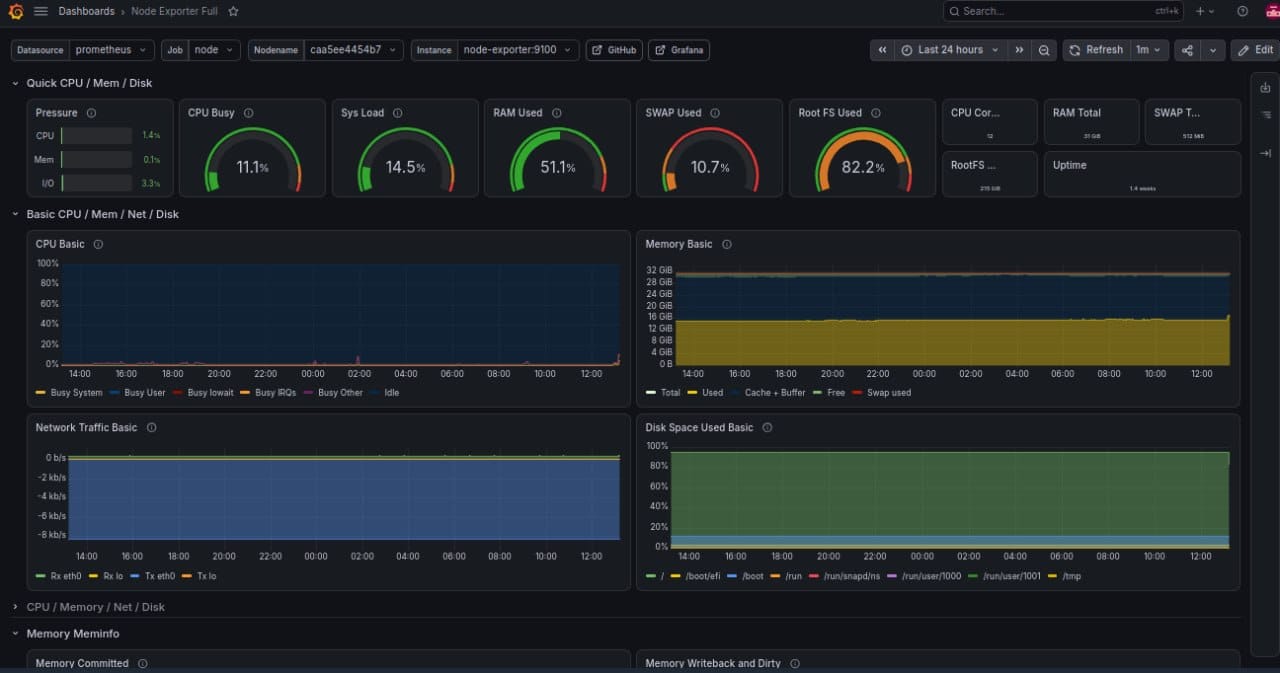
Grafana system overview
System — CPU, memory, swap and filesystem at a glance. Storage is flagged before it becomes an incident
Grafana network dashboard
Network — throughput and errors per interface, so a problem has a location
Grafana memory dashboard
Memory — committed memory, slab and writeback. Dull panels, until they explain why a service died at 4am
Read-only monitoring account
Access — the metrics exporter: read rights, one permitted source address
Telegram alert from Grafana
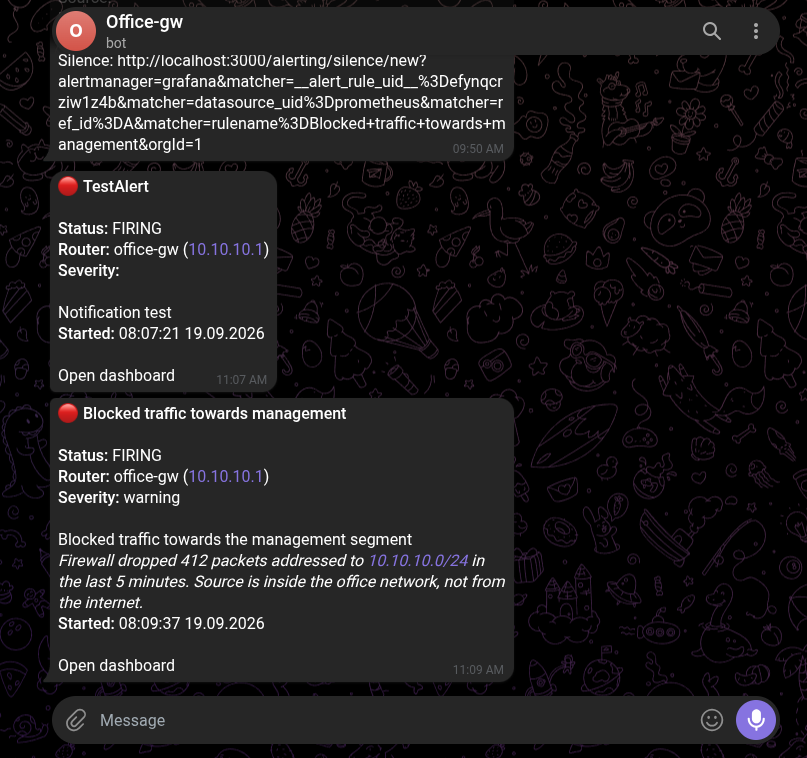
Alerting — what fired, on which host, since when, and a link to the dashboard

Equally important is what does not alert. A CPU spike that clears in two minutes is not an incident. Every rule here exists because its absence has cost someone a night.